More insights:
- Check out the SalesPage Blog for highlights and key takeaways from past Client Roundtables
- Follow our blog to stay up-to-date on industry insights
BI professionals from our client community (29 individuals from 16 asset managers) came together for a roundtable event to discuss how they’re activating data for marketing and distribution. Panelists shared their approaches to evaluating data sources, leveraging analytics tools, and identifying actionable opportunities for their teams. We also sent out a survey after the event with questions about sources and tools and a small but interesting subset of our client community, responded. Here’s what we learned from the event and survey.
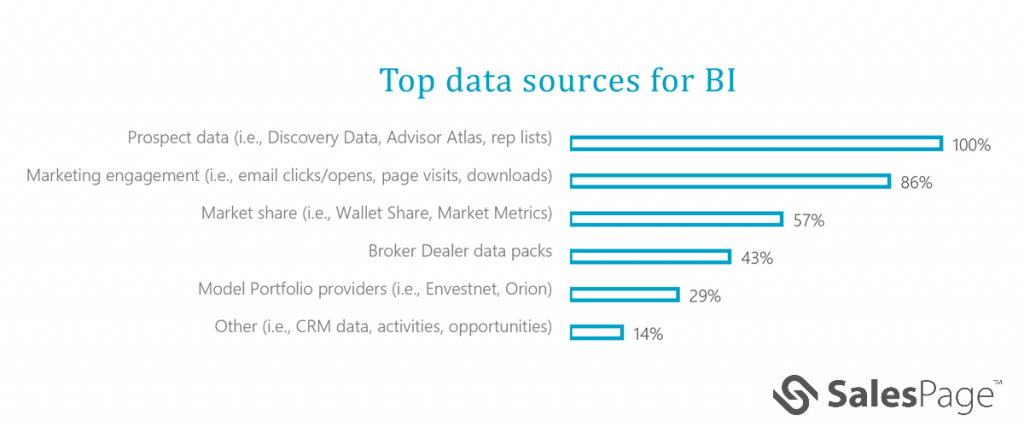
What data sources are you leveraging?
Our panel and audience included asset managers of different sizes, from boutique to medium and large global organizations. When it came to data sources, all firms found certain sources like prospect data from Discovery Data and Advisor Atlas valuable for helping to cleanse and augment the profiles of their clients and prospects.
What processes are you using to ensure good analytics?
When it came to data governance there was variation in resource and approach, but all firms seemed to agree on a common goal: creating the most complete and accurate data set possible. Here are some of the ways asset managers were achieving that goal:
- Boutique asset managers: Smaller firms generally have smaller teams, with members that wear multiple hats, and fewer data sources that they’re bringing together. Data analytics may comprise 1/4 of a role that also provides marketing, sales, and senior leadership analytics and reporting support. One approach to governance and ensuring good analytics: Bring multiple data sources (i.e., Discovery, Dakota RIA targeting, and data packs) together into a distribution data platform like SalesPage and integrate an analytics tool between that platform and CRM. For example, clients using Salesforce as a central repository for first-party data collected by Internals and Externals, have a great source of frontline information about clients and prospects. Incorporating rules to allow internals to enter data points helps capture that while keeping the system maintenance and data governance manageable.
- Medium-to-Large asset managers: Larger organizations typically have more teams and team members tackling data and BI operations. One team may solely focus on preparing data to make it accurate and ready for analysts. A mix of sources, services, and processes helps make that happen. SalesConnect was mentioned as a resource to help alleviate the workload for data stewardship by providing transaction resolution and data governance. LumaSuite was another solution being used to significantly accelerate data utilization and increase ROI on sources like broker dealer data packs by standardizing and matching it to master data so it’s easily ported into a distribution data platform or warehouse. To streamline and improve processes, building stewardship dashboards to help audit data quality was also mentioned as being beneficial. While having multiple data sources helps build out a robust profile, there is often conflicting information (i.e., an Internal identified a direct phone number for an advisor, but a third-party data source includes the office switchboard number) and there isn’t one right answer. Establishing a process to manage all versions of the truth can help.
What BI and analytics tools are helping you generate insights?
Several tools were mentioned when it came to generating, sharing or promoting, and getting teams to use insights from BI. This list includes commonly used tools mentioned in the discussion or shared in the survey, and our client’s comments about each tool’s utility.
- Microsoft Power BI: Cost-effective; easy to adopt when using Office 365; offers flexibility and a manageable support burden; can create interactive grids and dashboards for data team and specific access (not full access) to curated dashboards for the sales team.
- Tableau: Good for data visualization; requires dedicated resources to make it successful.
- IBM Cognos Analytics: End-users can help themselves with reports and report writers are able to update the Cognos framework and metadata to build dashboards for different teams (i.e., wholesalers, key accounts, executives).
- SalesPage: Includes data, analytics, and reporting capabilities within the platform, but also integrates with tools like Cognos, Tableau, Microsoft Power BI, and Oracle Business Intelligence, giving clients more flexibility in how they want to visualize and leverage data and intelligence.
- SalesPage Managed App: Canned reports can be served up in Salesforce for easy consumption by sales teams.
- Envestnet Analytics: Provides market intelligence that can be brought into the SalesPage platform.
- Data science tools: R, Python, SAS JMP, and Snowflake are tools used by data scientists who get their data from SalePage and data warehouses to generate insights.
Just as there isn’t one perfect data source, one BI tool doesn’t fit all. The panelists emphasized the importance of understanding what your teams want to know and what questions they want to have answered. This will help you pick the tool that makes the most sense (i.e., you have the resource to support it and it gets the questions answered).
What insights are teams asking for and how are you (or they) making those insights actionable?
Solving the “actionable” question all comes back to different systems and siloed information. The more you can sync data and systems, the better positioned you’ll be to deliver accurate, actionable business intelligence that teams are asking for. Examples shared:
- Rep movements: Running a weekly process that syncs with the SalesPage Managed App and CRM allows a sales team to easily act on the data.
- Marketing engagement: Setting up email and click-through activity to flow through a marketing system (i.e., Hubspot, Pardot) and integration into CRM helps uncover great leads, from new-to-you prospects or existing clients that haven’t done any business with you in 18+ months.
- Focused prospecting: Creating dashboards based on specific parameters (i.e., specific product focus, align with a marketing campaign, etc.) helps identify who to go after.
- Territory reviews: Pulling and presenting multiple data points from a territory on a quarterly to bi-annual basis helps experienced wholesalers see things in new ways and new wholesalers get a handle on their territory.
- Lead generation and redemption prevention: Leveraging tools like SS&C WalletShare helps you understand market share and determine if you can go after more in a specific product line. ForwardLane offers a connector with Salesforce that passes triggers to seed conversations. Discovery Data offers personal information like where an advisor went to college or military service, which can also be good conversation starters.
What’s next?
Distribution, Marketing and BI are all looking to gain efficiencies and improve effectiveness from continued sales and marketing teams’ collaboration, intentional technology expansion, and better insights to engage and enrich relationships.
If you’re looking to improve business intelligence to better enable your sales and marketing efforts and are uncertain about what the most effective approach would be for your firm, we’d be happy to discuss. Contact us or connect with me.
